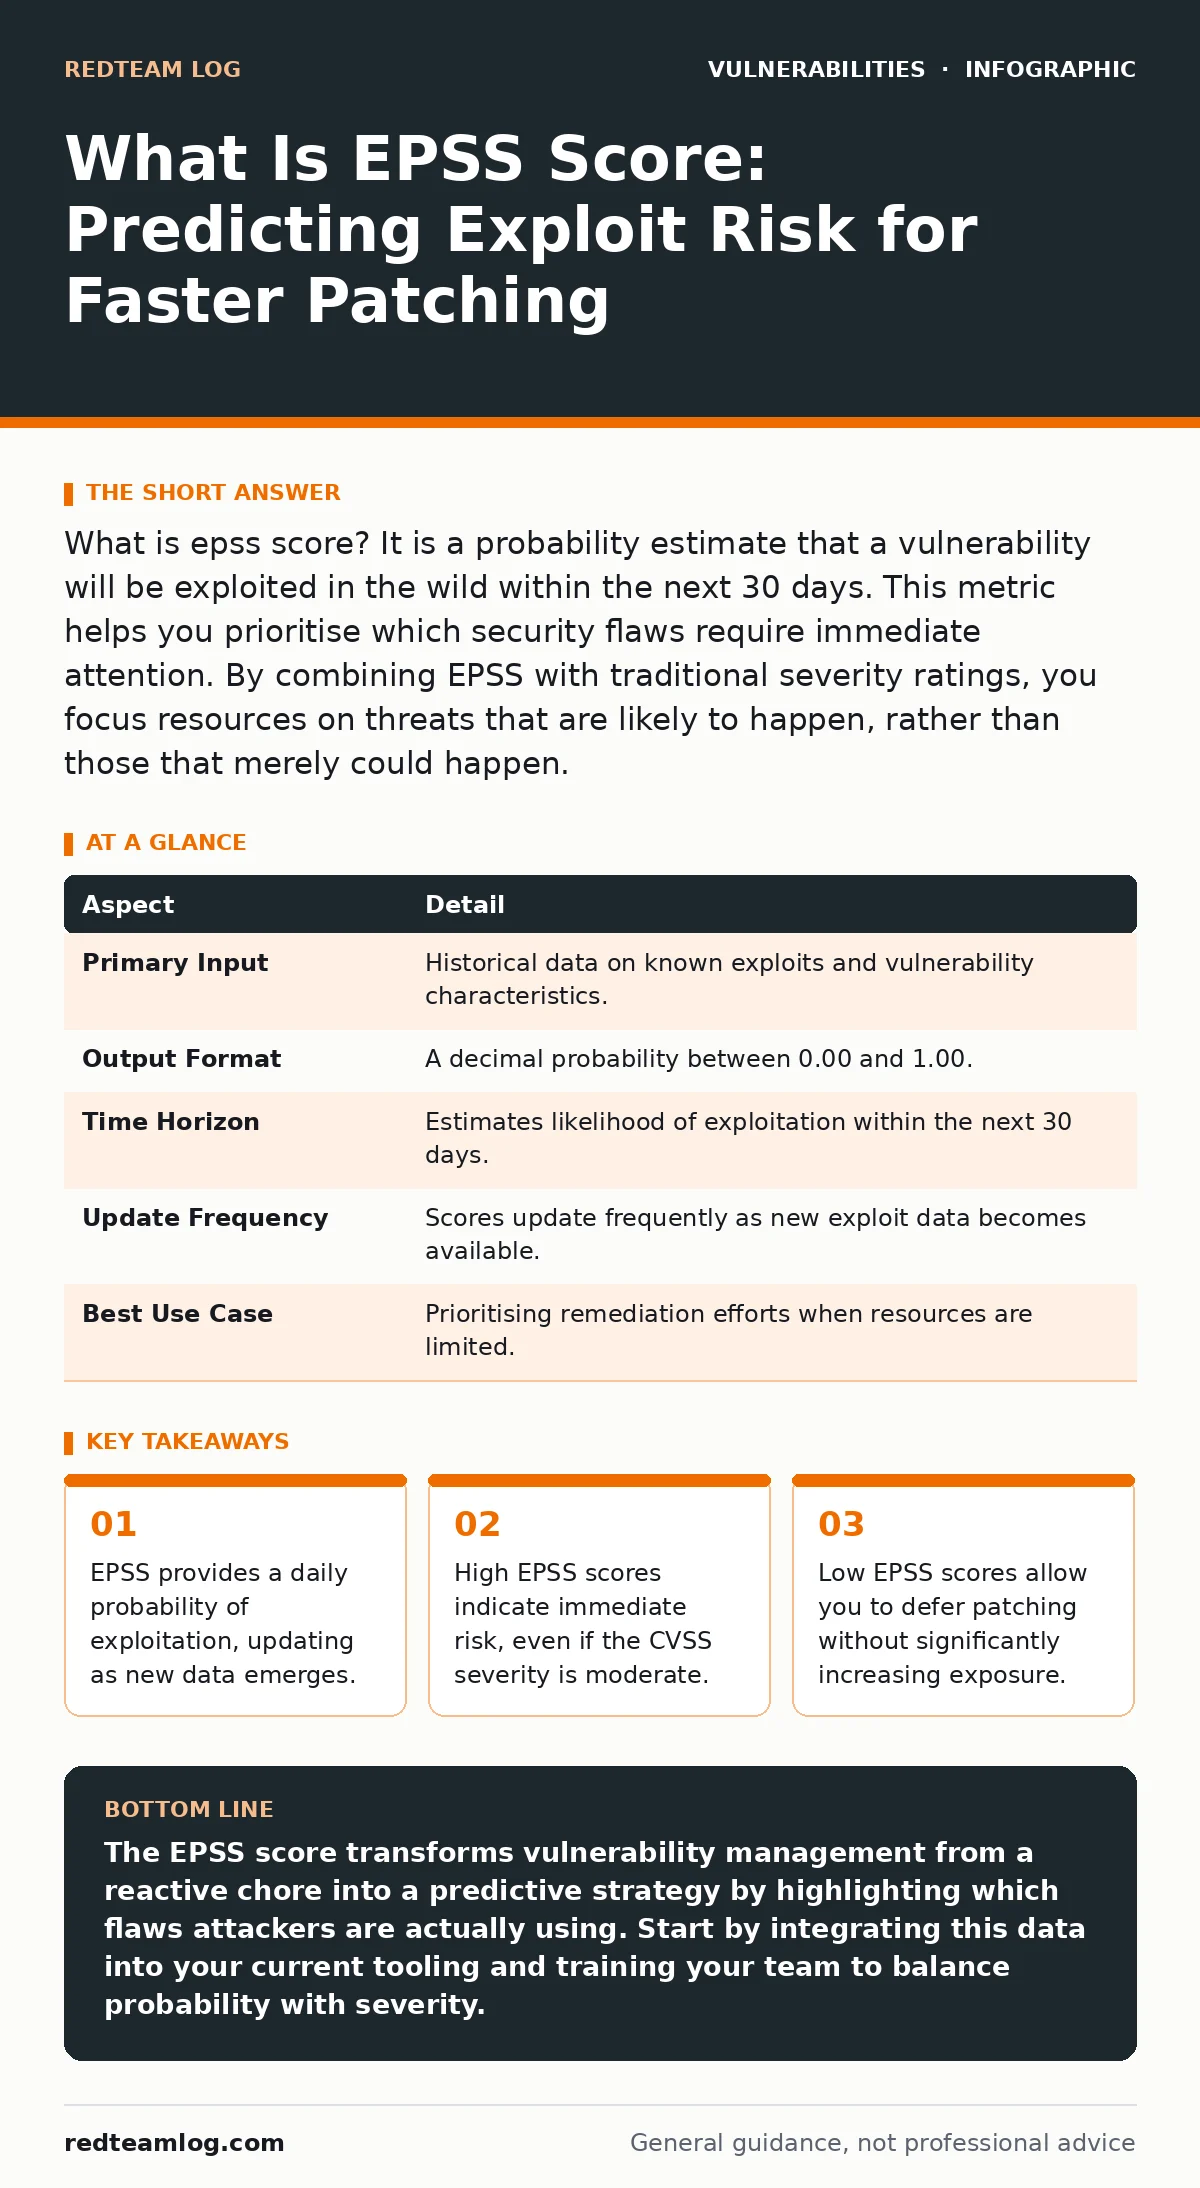
What is epss score? It is a probability estimate that a vulnerability will be exploited in the wild within the next 30 days. This metric helps you prioritise which security flaws require immediate attention. By combining EPSS with traditional severity ratings, you focus resources on threats that are likely to happen, rather than those that merely could happen.
Understanding the Core Mechanism
Imagine a security team facing a backlog of 500 open vulnerabilities. Every single one carries a high severity rating, suggesting they all demand immediate attention. The team lacks the bandwidth to fix them all at once. Which ones do they choose? Traditionally, teams relied on the Common Vulnerability Scoring System, or CVSS. CVSS measures the technical severity of a flaw. It tells you how damaging an exploit could be if it succeeds. It does not tell you whether anyone is actually trying to exploit it.
This is where the EPSS score changes the calculation. The Exploit Prediction Scoring System estimates the likelihood that a vulnerability will be exploited in the wild. It assigns a probability value between 0 and 1. This shift moves the focus from theoretical impact to practical probability. You stop guessing and start predicting.
| Aspect | Detail |
|---|---|
| Primary Input | Historical data on known exploits and vulnerability characteristics. |
| Output Format | A decimal probability between 0.00 and 1.00. |
| Time Horizon | Estimates likelihood of exploitation within the next 30 days. |
| Update Frequency | Scores update frequently as new exploit data becomes available. |
| Best Use Case | Prioritising remediation efforts when resources are limited. |
How the Model Calculates Probability
The model behind the score relies on machine learning. It analyses vast amounts of historical data regarding which vulnerabilities have been exploited in the past. It looks for patterns in the vulnerability data itself. Factors include the type of vulnerability, the affected software, and the availability of public exploit code. It does not look at your specific network environment. It looks at the global landscape of attack behaviour.
This approach reveals a counter-intuitive truth. Some vulnerabilities are technically severe but rarely targeted. Attackers often look for the path of least resistance. They prefer flaws that are easy to exploit and offer high reward. The model identifies these "hot" vulnerabilities. It assigns them higher probabilities. Conversely, it identifies flaws that are complex to exploit or offer little value. These receive lower probabilities. You can use this data to defer patching on low-probability items. This deferral is safe because the risk of exploitation is statistically minimal.
Who Benefits from Probabilistic Risk
This metric affects anyone responsible for managing software vulnerabilities. Security operations centres use it to triage alerts. They stop chasing false positives and theoretical risks. They focus on the threats that are actively moving. Development teams use it to decide when to release patches. They understand which fixes are urgent for their users. Executive stakeholders use it to justify budget requests. They can show that resources are directed toward actual risks, not just high numbers on a chart.
For managed service providers, the value is efficiency. You manage hundreds of clients. You cannot patch everything everywhere all at once. You need a clear hierarchy of risk. The score provides that hierarchy automatically. It removes the debate from the prioritisation process. You no longer argue about which flaw is "worse". You look at the data. The data tells you which flaw is more likely to be abused. This clarity speeds up decision-making. It reduces the mean time to remediation for the most dangerous flaws.
What People Usually Get Wrong
Many practitioners treat the score as a standalone truth. They ignore the context of their own environment. This is a critical error. The score predicts global exploitation likelihood. It does not know if your specific asset is exposed to the internet. It does not know if you have compensating controls in place. A high score on an internal, air-gapped server is less urgent than a low score on a public-facing web server. You must always apply context to the probability.
Another common mistake is ignoring the CVSS score entirely. The two metrics serve different purposes. CVSS tells you the impact. EPSS tells you the likelihood. You need both to understand risk. Risk is the product of likelihood and impact. A vulnerability with low likelihood but catastrophic impact still requires attention. A vulnerability with high likelihood but minor impact might be acceptable. You must balance these factors. Do not discard one metric in favour of the other. Use them together to form a complete picture.
Integrating Scores Into Workflow
You cannot simply read a number and act. You must integrate this data into your existing processes. Start by mapping your current vulnerability management workflow. Identify where you currently prioritise patches. Replace or augment that step with the new data. Most security tools now support this data natively. They pull the latest scores and display them alongside your asset inventory. You can filter your dashboard to show only high-probability risks.
This integration requires a change in mindset. Your team must accept that not all high-severity flaws are urgent. This can feel uncomfortable. It challenges the traditional view of security. You must educate your team on the difference between severity and likelihood. Show them the data. Demonstrate how focusing on high-probability risks reduces actual exposure. Over time, the team will trust the model. They will see that deferring low-probability patches does not lead to breaches. This trust is essential for long-term adoption.
See also: Remediation Tracking: Build a Closed-Loop System That Prevents Repeat Vulnerabilities · How a Software Bill of Materials Works: The Mechanism and Limits
Practical Steps for Implementation
- Audit your current tooling. Ensure your vulnerability scanner or ticketing system supports the latest scoring data. If it does not, consider upgrading.
- Define your thresholds. Decide what constitutes a "high" probability for your environment. 0.10 might be high for some. 0.01 might be high for others. Align this with your risk appetite.
- Train your analysts. Teach them to read the score in context. Explain the difference between CVSS and EPSS. Use real examples from your own environment.
- Monitor changes. Set up alerts for significant increases in score. A sudden jump indicates a new exploit or increased interest. This requires immediate attention.
- Review deferred patches. Regularly check the vulnerabilities you have chosen to defer. Ensure their scores remain low. If they rise, move them to the active patching queue.
This process reduces noise. It focuses your efforts on what matters. It makes your security posture more resilient. You are no longer reacting to every new flaw. You are predicting and preventing the most likely attacks. This proactive stance is the future of vulnerability management. It is a shift from volume to value. You spend your time on the risks that actually threaten your business.
Complementary Security Measures
Prioritisation is only one part of security. You must also address the root causes of vulnerability. Hard-coded credentials remain a persistent risk. They allow attackers to bypass authentication entirely. Ensure your development processes scan for these secrets. Prototype pollution attacks manipulate object properties in JavaScript applications. They can lead to remote code execution. Validate and sanitise all user inputs to prevent this.
PHP object injection flaws allow attackers to instantiate arbitrary objects. This can lead to serious data breaches. Disable magic quotes and validate object structures. Web cache poisoning attacks manipulate cached content to serve malicious data. Use strict caching headers and validate cache keys. Emergency patching procedures must be robust. They should allow you to deploy critical fixes quickly without breaking systems.
Content Security Policy headers help prevent cross-site scripting attacks. They restrict the sources from which scripts can load. File upload vulnerabilities allow attackers to place malicious files on your server. Validate file types and store uploads outside the web root. NoSQL injection attacks target database queries. Use parameterised queries to prevent this. These measures reduce the attack surface. They make exploitation harder, even if a vulnerability exists.
Key takeaways
- EPSS provides a daily probability of exploitation, updating as new data emerges.
- High EPSS scores indicate immediate risk, even if the CVSS severity is moderate.
- Low EPSS scores allow you to defer patching without significantly increasing exposure.
- Combining EPSS with CVSS creates a more accurate risk picture than either metric alone.
The EPSS score transforms vulnerability management from a reactive chore into a predictive strategy by highlighting which flaws attackers are actually using. Start by integrating this data into your current tooling and training your team to balance probability with severity.
Frequently asked questions
Does EPSS replace CVSS?
No, EPSS complements CVSS. CVSS measures the technical severity of a vulnerability, while EPSS measures the likelihood of it being exploited. You need both to assess risk accurately.
How often are EPSS scores updated?
Scores are updated frequently, often daily, as new data on exploits and vulnerabilities becomes available. This ensures the predictions remain current and relevant.
Can I use EPSS for internal-only systems?
Yes, but with caution. EPSS predicts global exploitation likelihood. For internal systems, you must adjust for your specific exposure and threat model. A low global score may still be high for a specific internal target.
What if a vulnerability has no EPSS score?
If a vulnerability has no score, it is likely new or obscure. In this case, rely on CVSS and your own risk assessment. Monitor for a score to appear as more data becomes available.
How this guide was produced: written by the RedTeam Log editorial team with AI assistance, checked against the public references listed below, and reviewed when the facts change. See our editorial policy or report an error.